立命館大学政策科学部 社会調査法 2026年度
近畿大学経営学部
2026/04/06
講義の概要
Rを使った分析のイメージ
参考文献
動画を見てください。Moodle+Rにリンクがあります。
動画では、講義の概要とこの講義で使うPosit Cloudというツールの始め方の説明をしています。
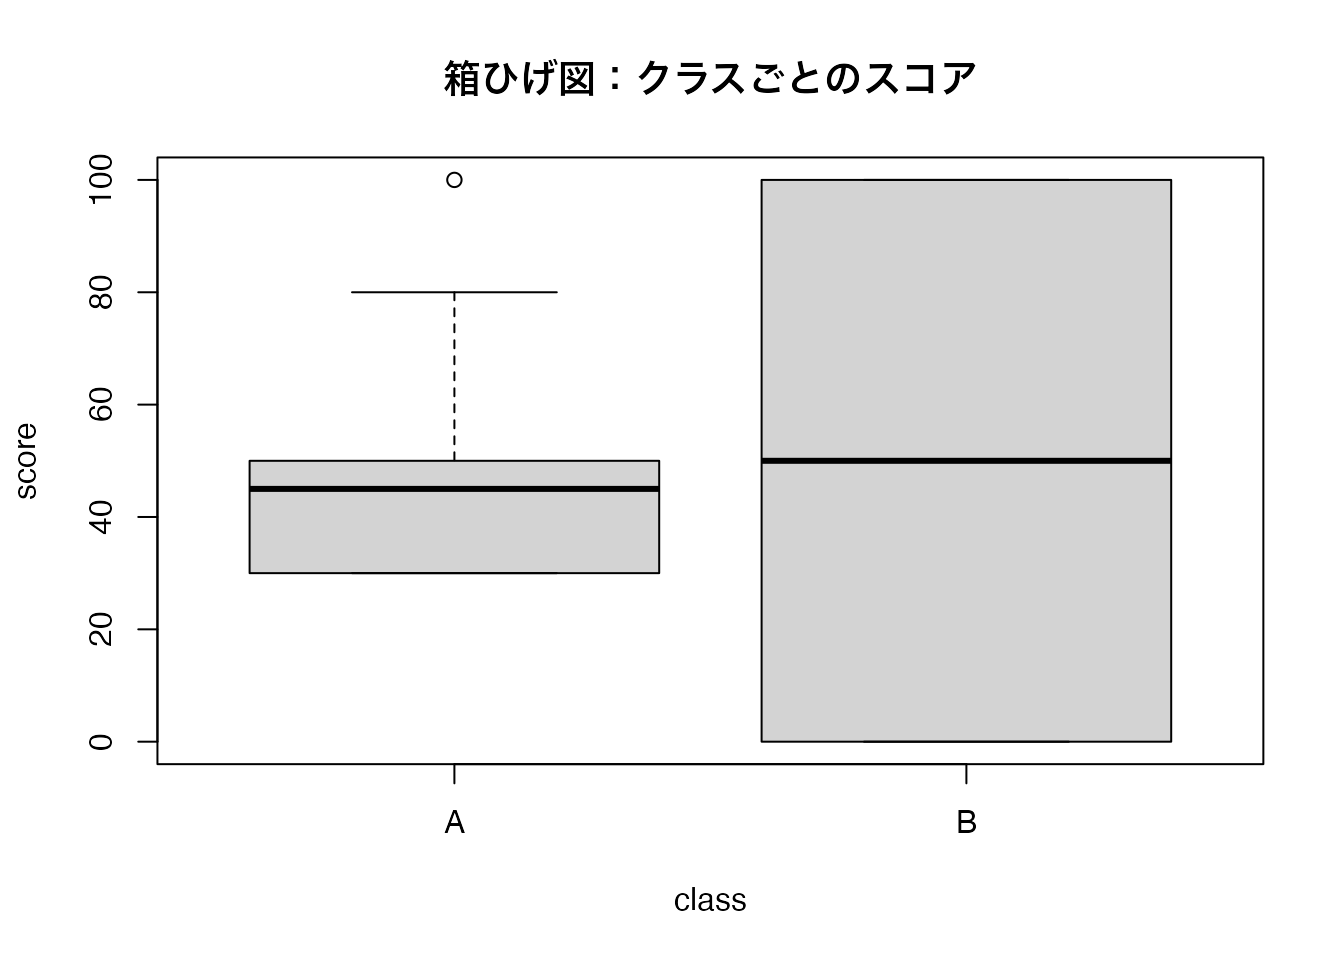
2つのクラスのデータがある
[1] 100 50 30 50 40 50 40 80 30 30
[1] 100 0 0 100 0 100 0 0 100 100
これらを表にまとめたり
datasummary_balance(score ~ class, data = datax)
平均値は同じだけど、標準偏差は異なる
図示したり
boxplot(score ~ class, data = datax, main = "箱ひげ図:クラスごとのスコア")
Bクラスの方がバラついている
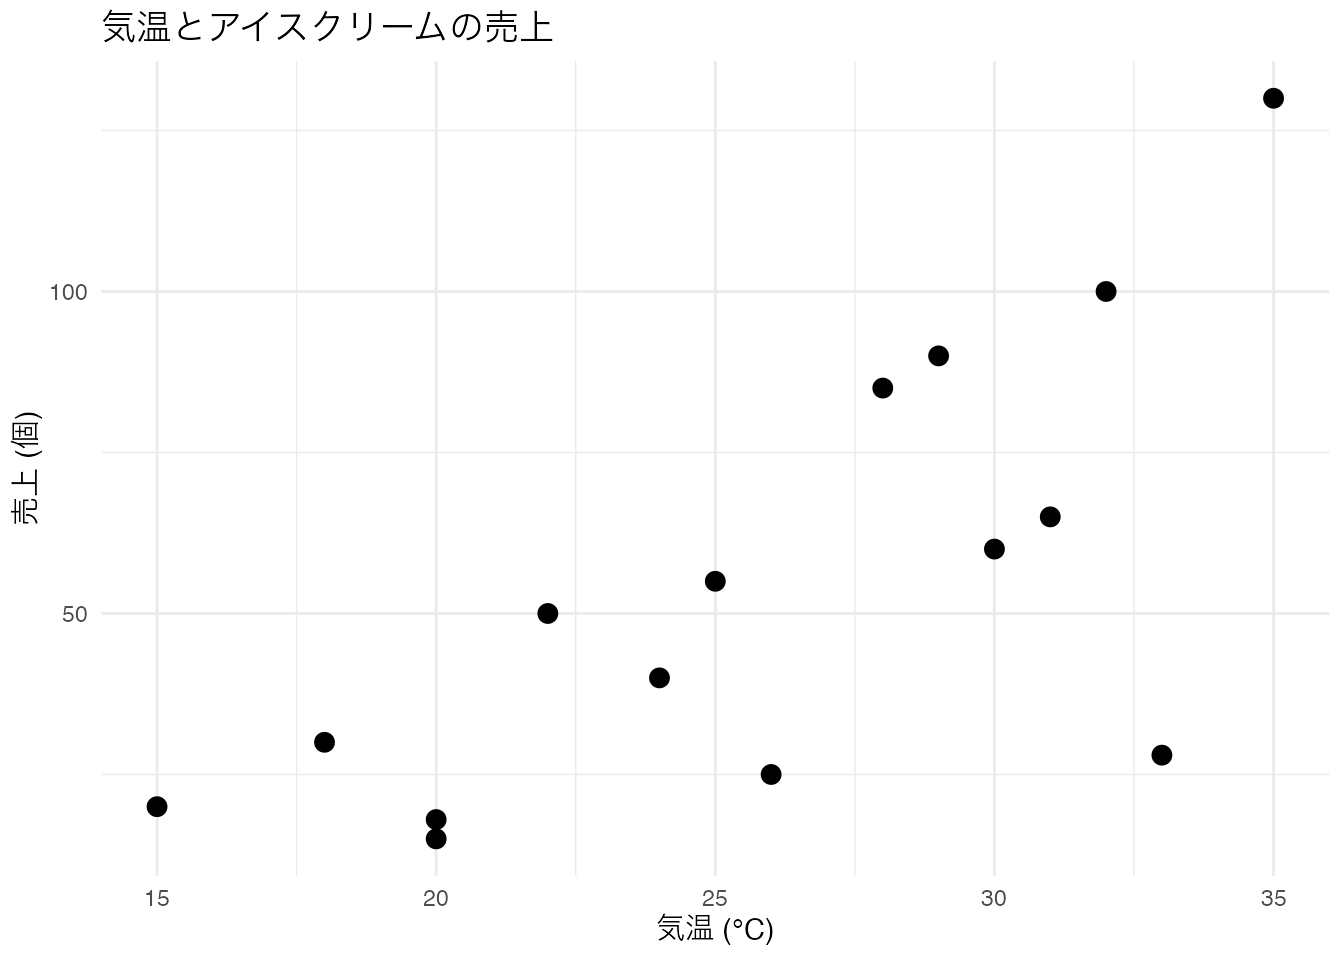
ggplot(icecream_data, aes(x = temperature, y = sales)) +
    geom_point( size = 3) +
    labs(
        title = "気温とアイスクリームの売上",
        x = "気温 (°C)",
        y = "売上 (個)"
    ) +
    theme_minimal()
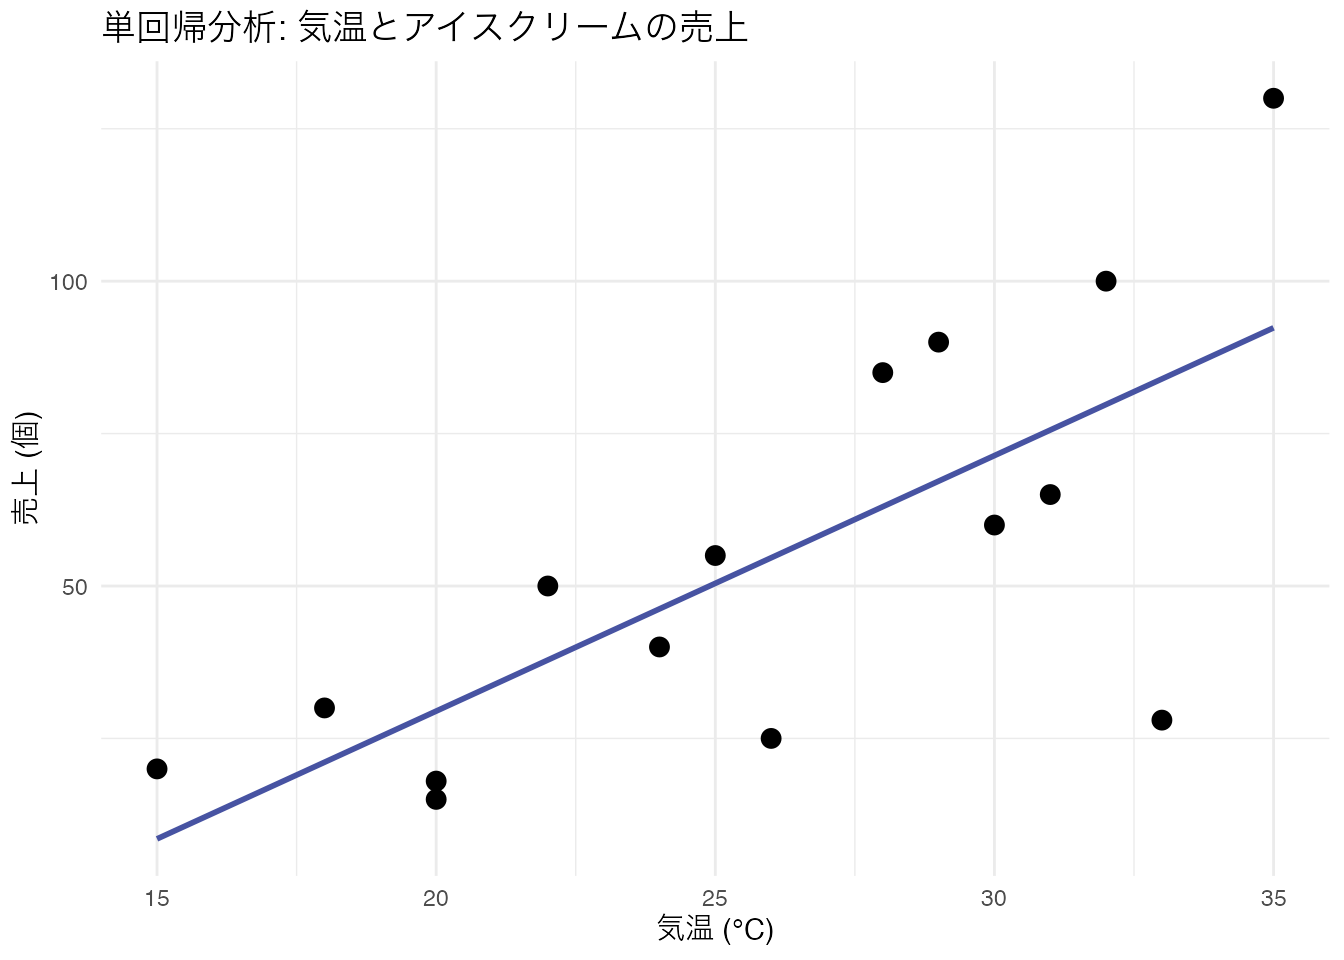
# 単回帰分析
model1 = lm(sales ~ temperature, data = icecream_data)

# 回帰直線を描く
ggplot(icecream_data, aes(x = temperature, y = sales)) +
    geom_point( size = 3) +
    geom_smooth(method = "lm", color = "#4753a2", se = FALSE) +
    labs(
        title = "単回帰分析: 気温とアイスクリームの売上",
        x = "気温 (°C)",
        y = "売上 (個)"
    ) +
    theme_minimal()
特に高気温では、予測される関係から大きく外れるものがある。
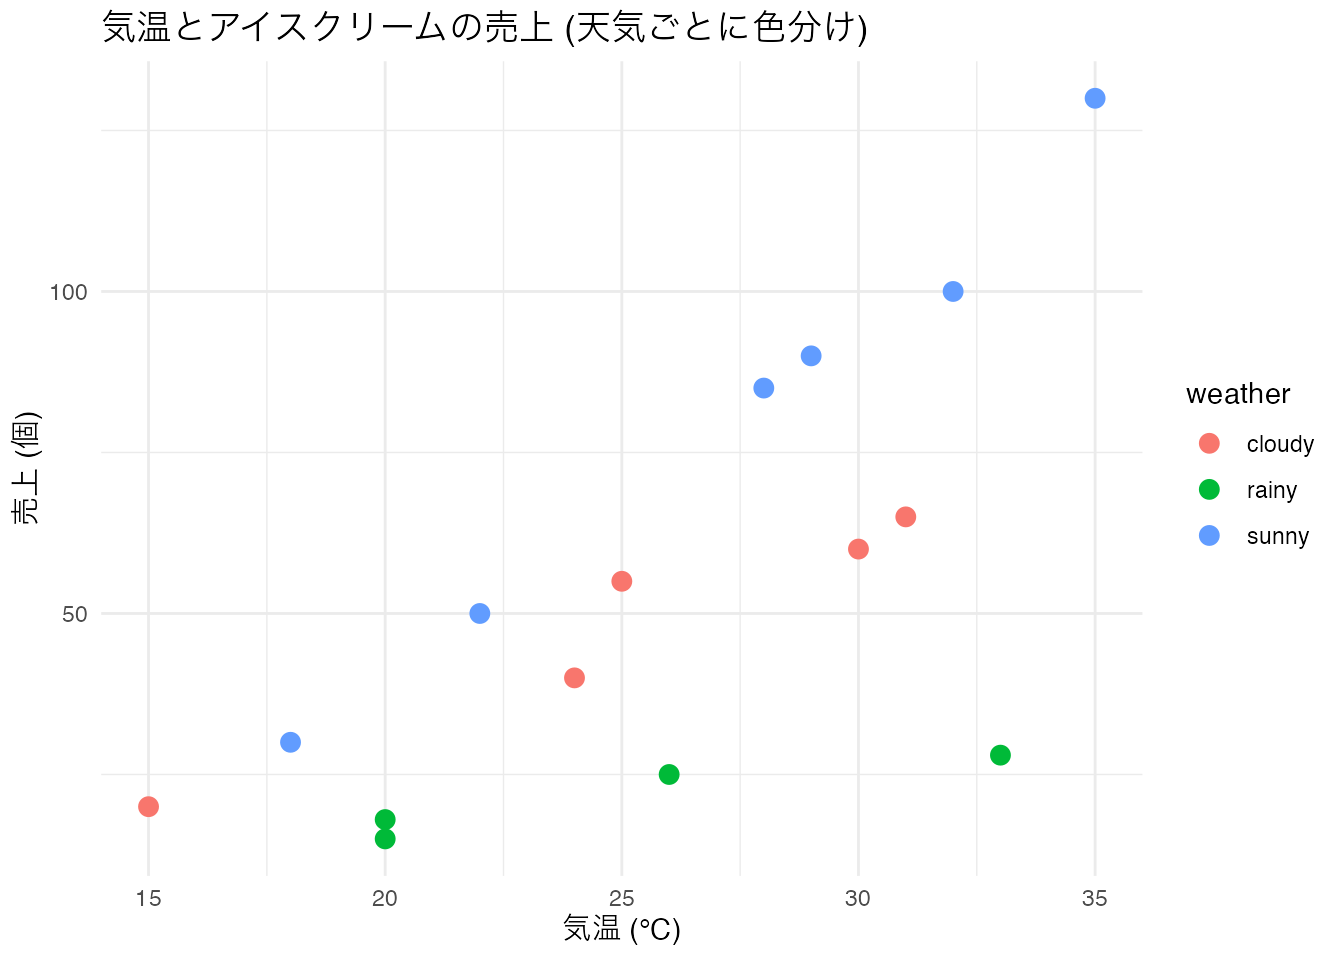
ggplot(icecream_data, aes(x = temperature, y = sales, color = weather)) +
    geom_point(size = 3) +
    labs(
        title = "気温とアイスクリームの売上 (天気ごとに色分け)",
        x = "気温 (°C)",
        y = "売上 (個)"
    ) +
    theme_minimal()
# 重回帰分析のモデル作成
model = lm(sales ~ temperature + weather, data = icecream_data)

# 結果を表示
summary(model)
Call:
lm(formula = sales ~ temperature + weather, data = icecream_data)

Residuals:
    Min      1Q  Median      3Q     Max
-22.592  -5.053   1.816   7.132  22.131

Coefficients:
             Estimate Std. Error t value Pr(>|t|)
(Intercept)  -40.1586    16.3328  -2.459  0.03175 *
temperature    3.5263     0.6086   5.794  0.00012 ***
weatherrainy -25.6184     8.9092  -2.875  0.01509 *
weathersunny  24.6052     8.1653   3.013  0.01179 *
---
Signif. codes:  0 '***' 0.001 '**' 0.01 '*' 0.05 '.' 0.1 ' ' 1

Residual standard error: 13.28 on 11 degrees of freedom
Multiple R-squared:  0.883, Adjusted R-squared:  0.8511
F-statistic: 27.68 on 3 and 11 DF,  p-value: 2.005e-05
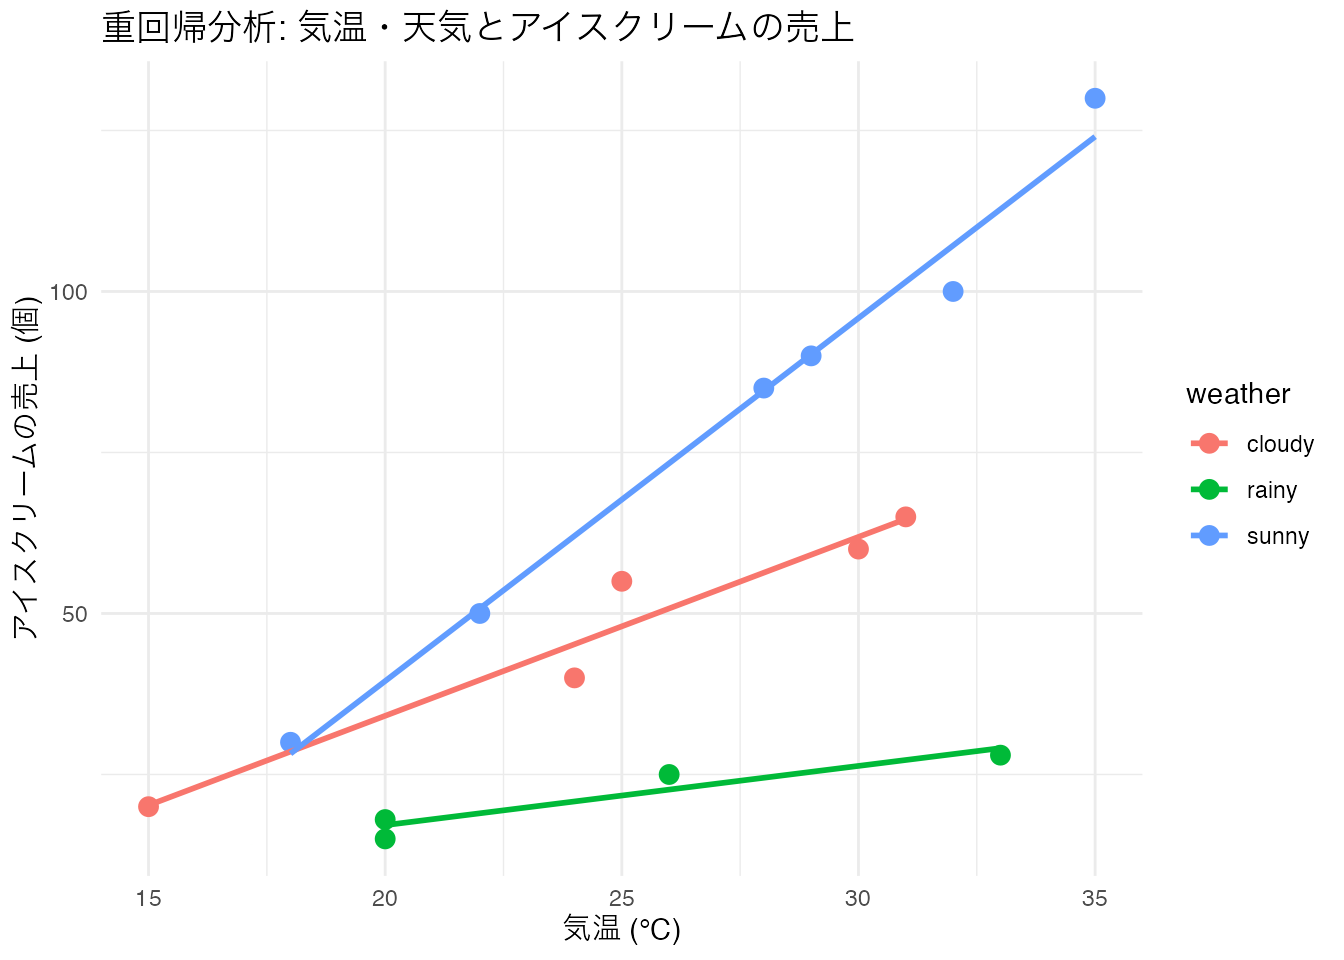
ggplot(icecream_data, aes(x = temperature, y = sales, color = weather)) +
    geom_point(size = 3) +
    geom_smooth(method = "lm", se = FALSE) +
    labs(
        title = "重回帰分析: 気温・天気とアイスクリームの売上",
        x = "気温 (°C)",
        y = "アイスクリームの売上 (個)"
    ) +
    theme_minimal()
天気と気温両方を考慮することで精度の高い売上予測が可能に
# 予測データ
new_data = data.frame(
    temperature = c(27, 27, 33, 33, 38, 38),
    weather = c("sunny", "rainy", "sunny", "cloudy", "sunny", "rainy")
)

# 予測
predicted_sales = predict(model, new_data)

# 予測結果を表示
data.frame(new_data, Predicted_Sales = predicted_sales)